Introduction
Adverse events (AE) are a crucial aspect of clinical trials,
providing insight into the safety profile of treatments. The
DescribeAE package provides functions to summarize and
visualize adverse events by different criteria such as System
Organ Class (SOC), Preferred Term (PT), and
Grade.
This vignette demonstrates how to use two core functions:
-
desc_ei_per_pt(): Summarizes adverse events by System Organ Class (SOC) and Preferred Term (PT). -
desc_ei_per_grade(): Summarizes adverse events by grade, which represents severity.
These functions generate tables that help interpret the distribution of adverse events across different treatment arms in a randomized controlled trial (RCT).
Toy dataset
Before using these functions, we need to create a toy datasets. Below is an example of how to structure the data.
Recording Adverse Events by LLT, PT, SOC and Grade
df_pat_llt <- data.frame(
  USUBJID = c("ID_1", "ID_1", "ID_2", "ID_8", "ID_9"),
  EINUM = c(1, 2, 1, 1, 1),
  EILLTN = c("llt1", "llt2", "llt1", "llt3", "llt4"),
  EIPTN = c("Arrhythmia", "Myocardial Infarction", "Myocardial Infarction", "Pneumonia", "Pneumonia"),
  EISOCPN = c("Cardiac Disorders", "Cardiac Disorders", "Cardiac Disorders", "Infections", "Infections"),
  EIGRDM = c(1, 3, 4, 2, 4),
  EIGRAV = c("Grave", "Non grave", "Non grave", "Non grave", "Grave")
)
Summarizing Adverse Events
Describing Adverse Events by System Organ Class
To analyze adverse events based on their System Organ Class
(SOC) and Preferred Term (PT), use the
desc_ei_per_pt() function:
desc_ei_per_pt(df_pat_grp = df_pat_grp,
df_pat_llt = df_pat_llt)| Evénements indésirables |
Total
|
A
|
B
|
C
|
||||
|---|---|---|---|---|---|---|---|---|
| AE N (%) |
Patient N (%) |
AE N (%) |
Patient N (%) |
AE N (%) |
Patient N (%) |
AE N (%) |
Patient N (%) |
|
| Total | ||||||||
| Total | 5 (100.0) | 4 (40.0) | 3 (100.0) | 2 (66.7) | 0 ( 0.0) | 0 ( 0.0) | 2 (100.0) | 2 (50.0) |
| Cardiac Disorders | ||||||||
| Total | 3 ( 60.0) | 2 (20.0) | 3 (100.0) | 2 (66.7) | ||||
| Myocardial Infarction | 2 ( 40.0) | 2 (20.0) | 2 ( 66.7) | 2 (66.7) | ||||
| Arrhythmia | 1 ( 20.0) | 1 (10.0) | 1 ( 33.3) | 1 (33.3) | ||||
| Infections | ||||||||
| Total | 2 ( 40.0) | 2 (20.0) | 2 (100.0) | 2 (50.0) | ||||
| Pneumonia | 2 ( 40.0) | 2 (20.0) | 2 (100.0) | 2 (50.0) | ||||
Describing Adverse Events by Grade
To assess the severity of adverse events across treatment arms, use
desc_ei_per_grade():
desc_ei_per_grade(df_pat_grp = df_pat_grp,
df_pat_grade = df_pat_llt)| Grade |
Total
|
A
|
B
|
C
|
||||
|---|---|---|---|---|---|---|---|---|
| AE N (%) |
Patient N (%) |
AE N (%) |
Patient N (%) |
AE N (%) |
Patient N (%) |
AE N (%) |
Patient N (%) |
|
| Any grade | 5 (100.0) | 4 (40.0) | 3 (100.0) | 2 (66.7) | 0 ( 0.0) | 0 ( 0.0) | 2 (100.0) | 2 (50.0) |
| 1 | 1 ( 20.0) | 1 (10.0) | 1 ( 33.3) | 1 (33.3) | ||||
| 2 | 1 ( 20.0) | 1 (10.0) | 1 ( 50.0) | 1 (25.0) | ||||
| 3 | 1 ( 20.0) | 1 (10.0) | 1 ( 33.3) | 1 (33.3) | ||||
| 4 | 2 ( 40.0) | 2 (20.0) | 1 ( 33.3) | 1 (33.3) | 1 ( 50.0) | 1 (25.0) | ||
| SAE | 2 ( 40.0) | 2 (20.0) | 1 ( 33.3) | 1 (33.3) | 1 ( 50.0) | 1 (25.0) | ||
What if you have only one group ?
In that case the table df_pat_grp must still be provided
with RDGRPNAME set to “Total” (or any other string)
desc_ei_per_pt(df_pat_grp = df_pat_grp |> dplyr::mutate(RDGRPNAME = "A"),
df_pat_llt = df_pat_llt)| Evénements indésirables |
Total
|
|
|---|---|---|
| AE N (%) |
Patient N (%) |
|
| Total | ||
| Total | 5 (100.0) | 4 (40.0) |
| Cardiac Disorders | ||
| Total | 3 ( 60.0) | 2 (20.0) |
| Myocardial Infarction | 2 ( 40.0) | 2 (20.0) |
| Arrhythmia | 1 ( 20.0) | 1 (10.0) |
| Infections | ||
| Total | 2 ( 40.0) | 2 (20.0) |
| Pneumonia | 2 ( 40.0) | 2 (20.0) |
desc_ei_per_grade(df_pat_grp = df_pat_grp,
df_pat_grade = df_pat_llt |> dplyr::mutate(RDGRPNAME = "A"))| Grade |
Total
|
A
|
B
|
C
|
||||
|---|---|---|---|---|---|---|---|---|
| AE N (%) |
Patient N (%) |
AE N (%) |
Patient N (%) |
AE N (%) |
Patient N (%) |
AE N (%) |
Patient N (%) |
|
| Any grade | 5 (100.0) | 4 (40.0) | 3 (100.0) | 2 (66.7) | 0 ( 0.0) | 0 ( 0.0) | 2 (100.0) | 2 (50.0) |
| 1 | 1 ( 20.0) | 1 (10.0) | 1 ( 33.3) | 1 (33.3) | ||||
| 2 | 1 ( 20.0) | 1 (10.0) | 1 ( 50.0) | 1 (25.0) | ||||
| 3 | 1 ( 20.0) | 1 (10.0) | 1 ( 33.3) | 1 (33.3) | ||||
| 4 | 2 ( 40.0) | 2 (20.0) | 1 ( 33.3) | 1 (33.3) | 1 ( 50.0) | 1 (25.0) | ||
| SAE | 2 ( 40.0) | 2 (20.0) | 1 ( 33.3) | 1 (33.3) | 1 ( 50.0) | 1 (25.0) | ||
Plot Adverse Events
This section provides several visualization methods for adverse events (AEs) based on patient data. Currently, these plots support only two groups. Future work may involve migration to aevisR for enhanced functionality.
First, we define the two patients group:
Dumbell plot
The dumbbell plot visualizes the difference in AE occurrence between the two groups. It highlights the absolute risk difference for each AE.
plot_dumbell(df_pat_llt = df_pat_llt,
             df_pat_grp = df_pat_grp)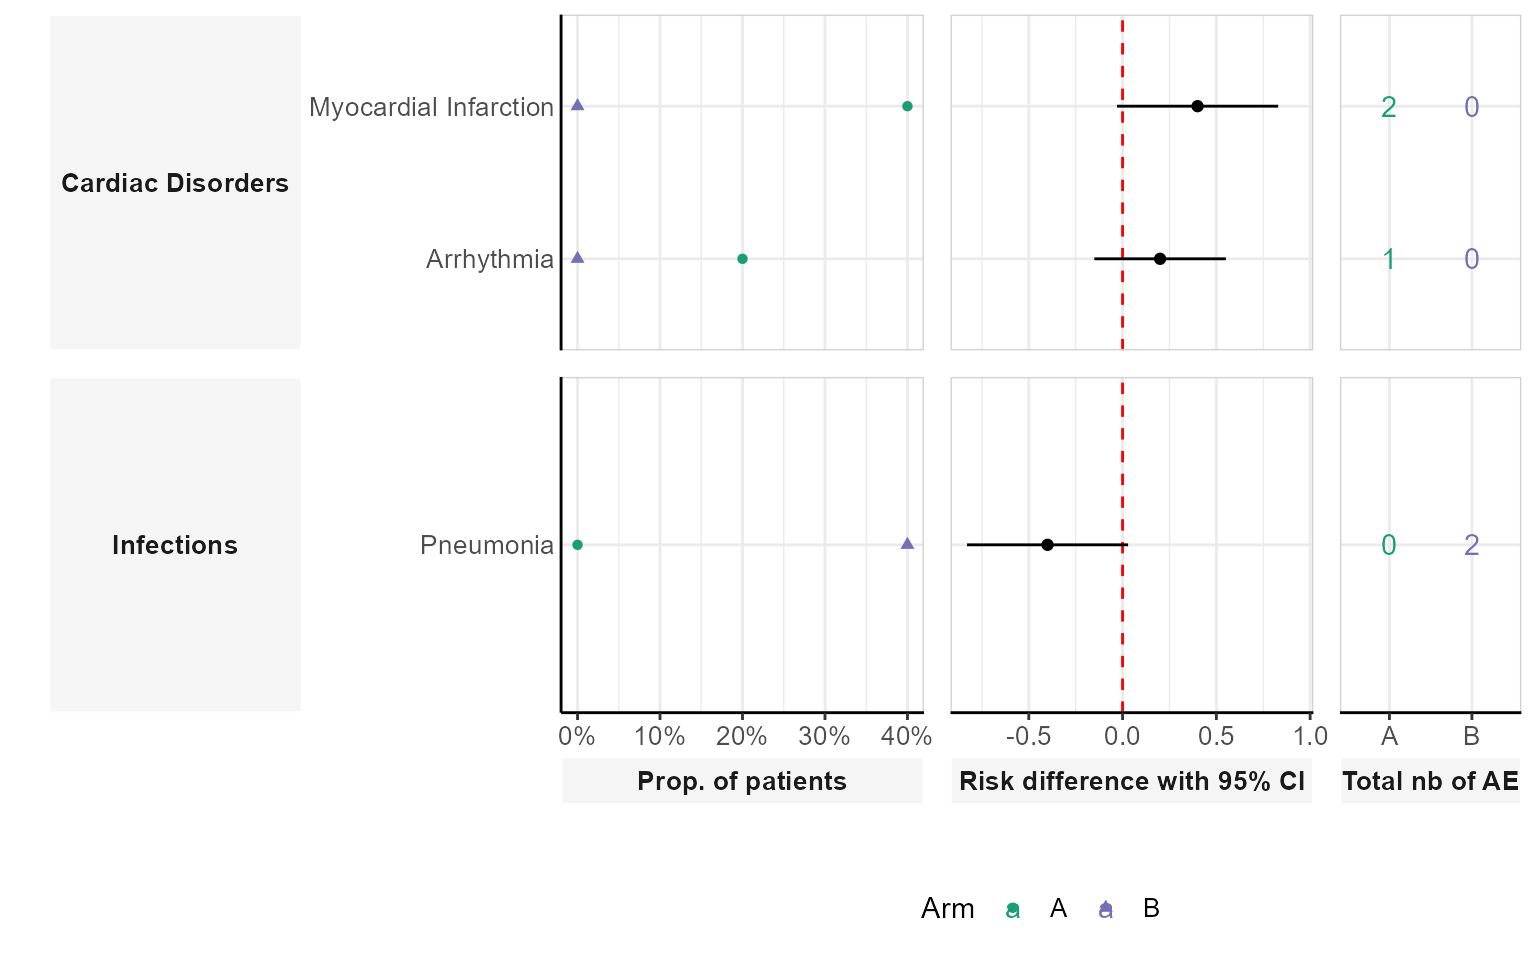
Volcano plot
The volcano plot displays the association between risk differences and statistical significance (-log10 p-values). This helps identify AEs that differ significantly between groups.
plot_volcano(df_pat_llt = df_pat_llt,
             df_pat_grp = df_pat_grp)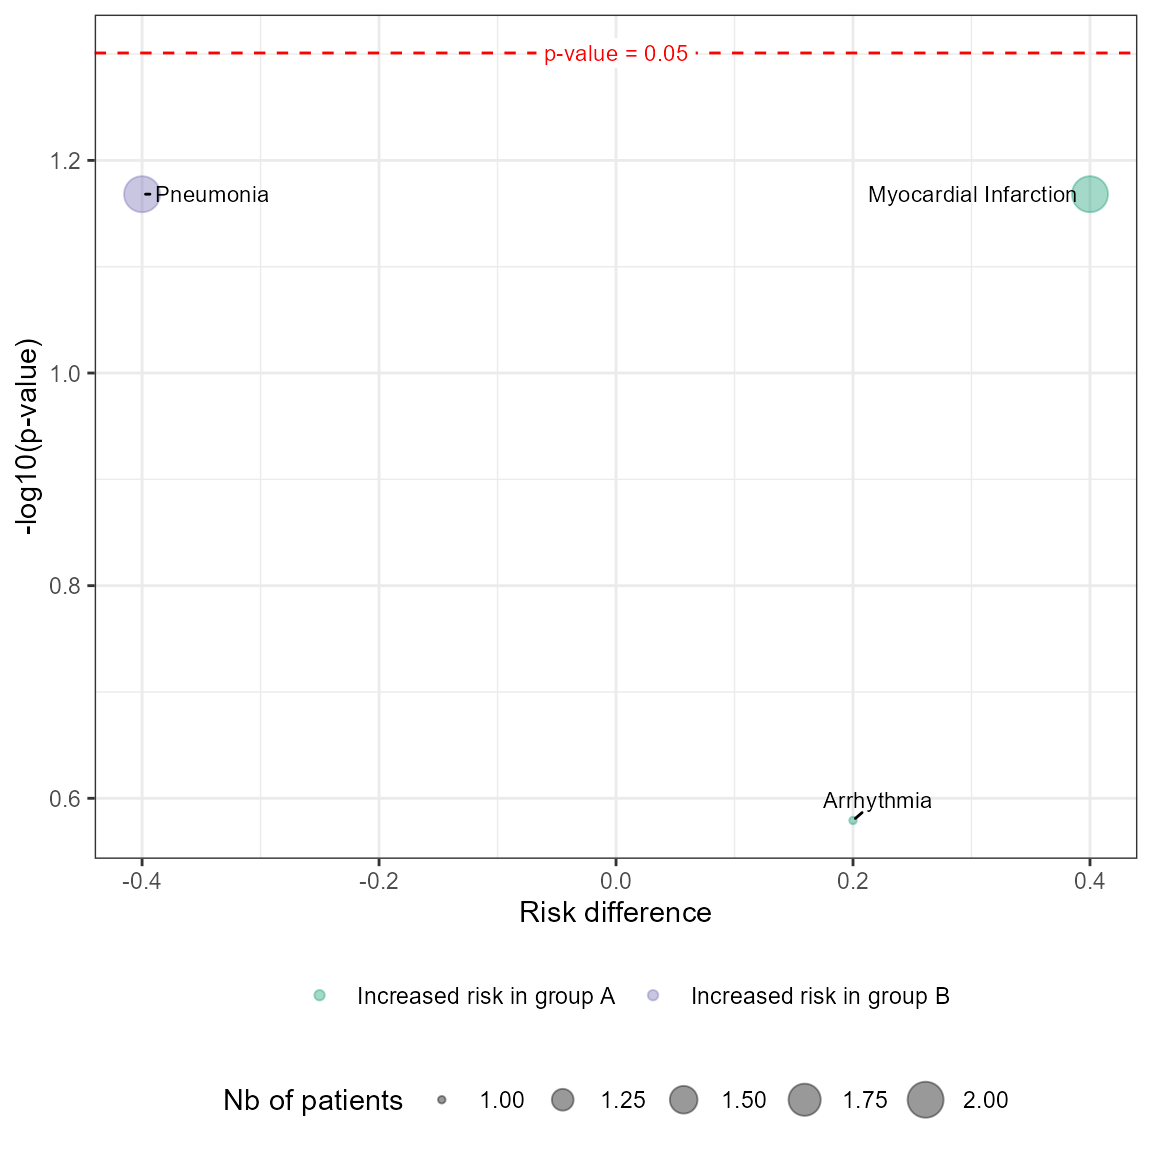
Butterfly plot
The butterfly stacked bar plot compares AE frequencies across groups while stacking by severity grade. It provides a detailed view of AE distributions.
plot_butterfly_stacked_barplot(df_pat_llt = df_pat_llt,
                               df_pat_grp = df_pat_grp)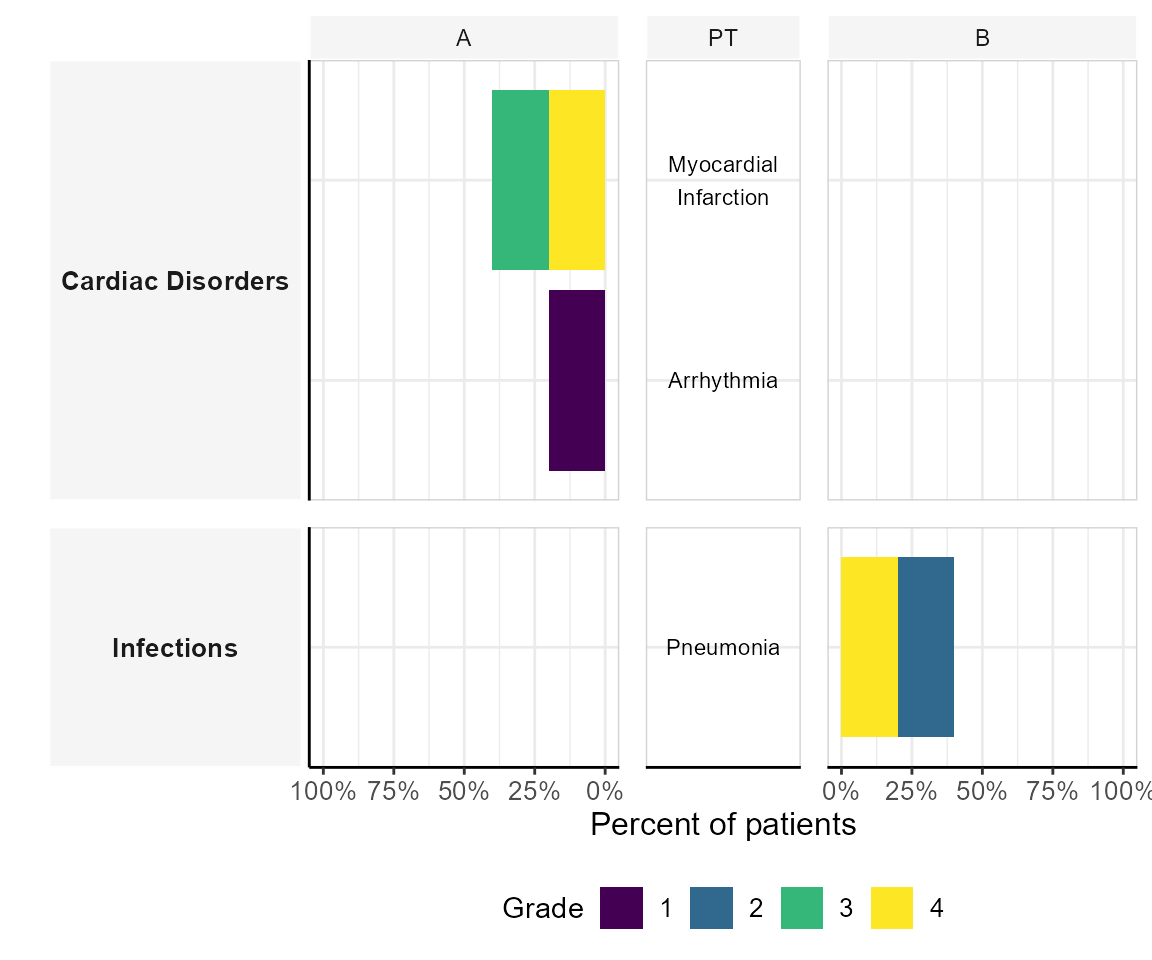
Conclusion
The DescribeAE package provides a structured approach to
summarizing and visualizing adverse events in clinical trials. By using
desc_ei_per_soc() and desc_ei_per_grade(),
researchers can:
- Identify which organ systems are most affected.
- Compare the frequency and severity of adverse events across treatment arms.
- Gain insights into the safety profile of treatments.
These summaries support better decision-making in clinical trial analyses, ensuring a comprehensive evaluation of adverse events. For further customization, users can preprocess their data accordingly before applying these functions.