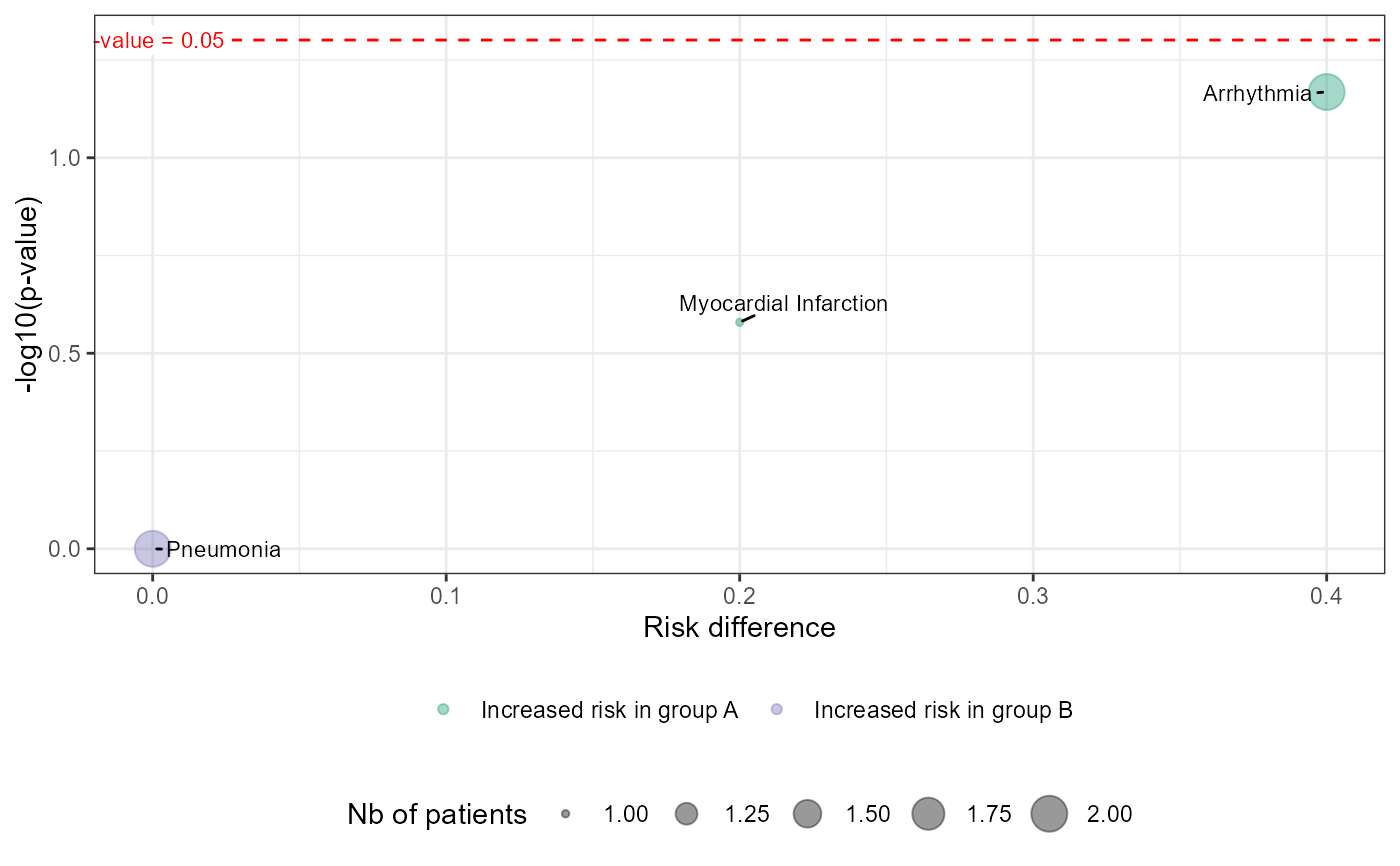
Generates a volcano plot to visualize the association between adverse events and patient groups.
plot_volcano(
  df_pat_grp,
  df_pat_llt,
  ref_grp = NULL,
  colors_arm = c("#1b9e77", "#7570b3"),
  size = "nb_pat"
)
Arguments
- df_pat_grp
A data frame of patient groups. Must contain columns
USUBJID(patient ID) andRDGRPNAME(group assignment).- df_pat_llt
A data frame with USUBJID (subject ID), EINUM (AE ID), EILLTN (LLT identifier), EIPTN (PT identifier), EISOCPN (soc identifier) and EIGRDM (severity grade)
- ref_grp
(Optional) A reference group for comparisons. Defaults to the first group in
df_pat_grp.- colors_arm
A character vector of length two specifying the colors for the two patient groups in the plot. Default is
c("#1b9e77", "#7570b3").- size
A character string specifying the metric used for point sizes in the plot. Options are:
"nb_pat": Number of patients (default)."nb_ei": Number of adverse events.
Value
A ggplot2 object representing the volcano plot.
Details
The function first processes input data using df_builder_ae(), then calculates relevant statistics
such as risk difference (RD) and p-values. The volcano plot displays:
RDon the x-axis (risk difference between groups).-log10(p-value)on the y-axis (significance level).Point colors indicating which group has an increased risk.
Point sizes reflecting either the number of patients or events.
A horizontal dashed line at p = 0.05 for significance threshold.
Examples
df_pat_grp <- data.frame(
 USUBJID = paste0("ID_", 1:10),
 RDGRPNAME = c(rep("A", 5), rep("B", 5))
)

df_pat_llt <- data.frame(
  USUBJID = c("ID_1", "ID_1", "ID_2", "ID_4", "ID_9"),
  EINUM = c(1, 2, 1, 1, 1),
  EILLTN = c("llt1", "llt2", "llt1", "llt3", "llt4"),
  EIPTN = c("Arrhythmia", "Myocardial Infarction", "Arrhythmia", "Pneumonia", "Pneumonia"),
  EISOCPN = c("Cardiac Disorders", "Cardiac Disorders", "Cardiac Disorders",
  "Infections", "Infections"),
  EIGRDM = c(1, 3, 4, 2, 4)
)

plot_volcano(df_pat_grp, df_pat_llt)