Butterfly Stacked Bar Plot for Adverse Event Grades
Source:R/plot_butterfly_stacked_barplot.R
plot_butterfly_stacked_barplot.RdCreates a butterfly stacked bar plot to visualize the frequency of adverse event (AE) grades across patient groups, with system organ class (SOC) and preferred terms (PT) as labels.
plot_butterfly_stacked_barplot(
  df_pat_grp,
  df_pat_llt,
  ref_grp = NULL,
  max_text_width = 9,
  vec_fill_color = viridis::viridis(n = 4)
)
Arguments
- df_pat_grp
A data frame of patient groups. Must contain columns
USUBJID(patient ID) andRDGRPNAME(group assignment).- df_pat_llt
A data frame with USUBJID (subject ID), EINUM (AE ID), EILLTN (LLT identifier), EIPTN (PT identifier), EISOCPN (soc identifier) and EIGRDM (severity grade)
- ref_grp
A character string specifying the reference group (used for alignment in the plot). If NULL (default), the first level of
df_pat_grp$grpis used.- max_text_width
An integer specifying the maximum width (in characters) for SOC labels before wrapping to the next line. Default is 9.
- vec_fill_color
A vector of colors used for filling the AE grade bars. Default is
viridis::viridis(n = 4).
Value
A ggplot2 object representing the butterfly stacked bar plot.
Details
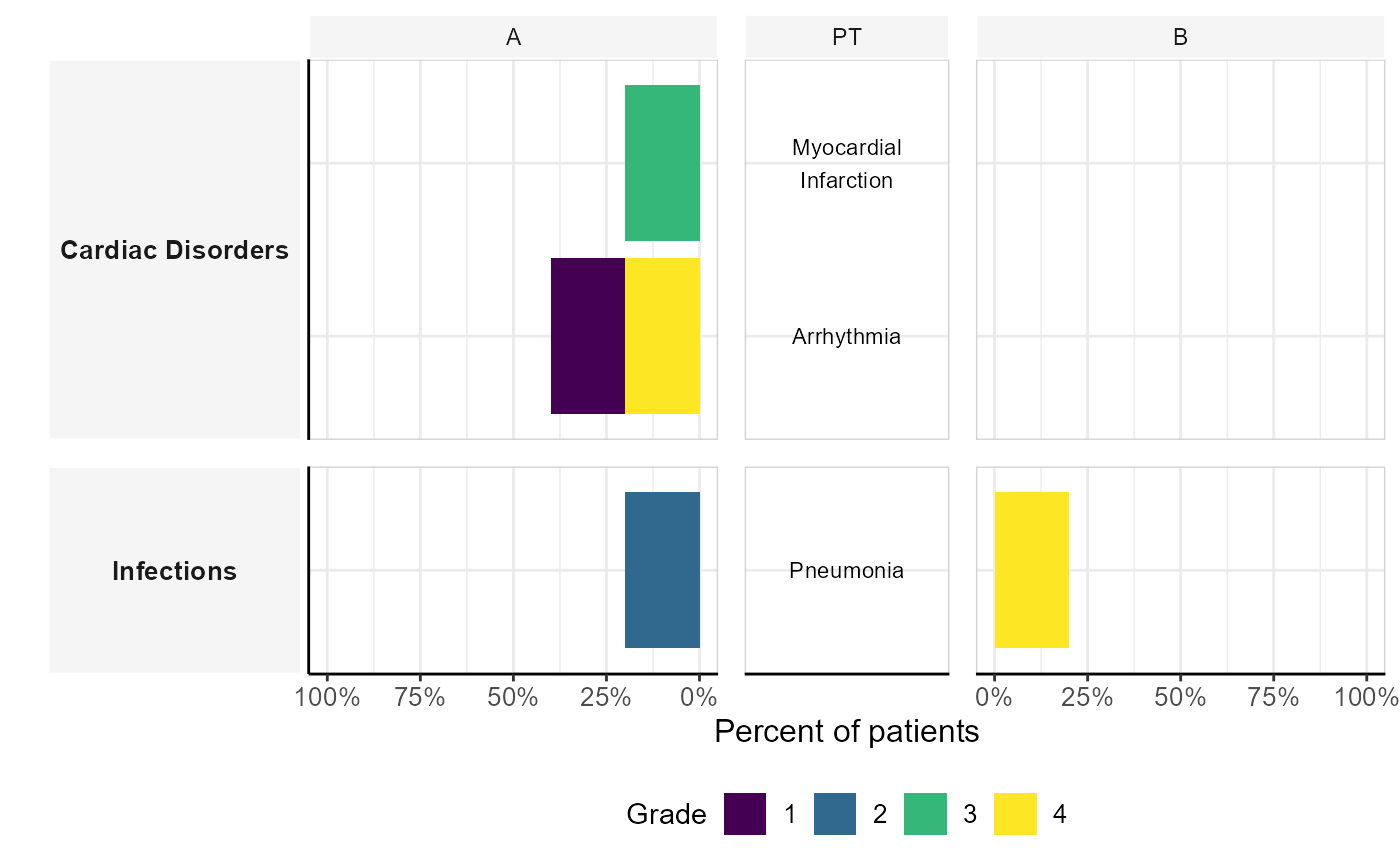
The function processes input data to calculate the frequency of adverse events per patient group and AE grade. It then generates a stacked bar plot where:
The x-axis represents the percentage of patients experiencing an AE.
The y-axis represents PTs (with SOCs as facets).
Bars are stacked by AE grade.
Labels for PTs are displayed in the center.
The left and right panels correspond to different patient groups.
The function utilizes the ggh4x package to adjust panel sizes and axes for a symmetrical
butterfly plot.
Examples
df_pat_grp <- data.frame(
 USUBJID = paste0("ID_", 1:10),
 RDGRPNAME = c(rep("A", 5), rep("B", 5))
)

df_pat_llt <- data.frame(
  USUBJID = c("ID_1", "ID_1", "ID_2", "ID_4", "ID_9"),
  EINUM = c(1, 2, 1, 1, 1),
  EILLTN = c("llt1", "llt2", "llt1", "llt3", "llt4"),
  EIPTN = c("Arrhythmia", "Myocardial Infarction", "Arrhythmia", "Pneumonia", "Pneumonia"),
  EISOCPN = c("Cardiac Disorders", "Cardiac Disorders", "Cardiac Disorders",
  "Infections", "Infections"),
  EIGRDM = c(1, 3, 4, 2, 4)
)

plot_butterfly_stacked_barplot(df_pat_grp, df_pat_llt)
#> Warning: no non-missing arguments to min; returning Inf
#> Warning: no non-missing arguments to max; returning -Inf
#> Warning: no non-missing arguments to min; returning Inf
#> Warning: no non-missing arguments to min; returning Inf
#> Warning: no non-missing arguments to max; returning -Inf
#> Warning: no non-missing arguments to min; returning Inf
#> Warning: no non-missing arguments to min; returning Inf
#> Warning: no non-missing arguments to max; returning -Inf
#> Warning: no non-missing arguments to min; returning Inf