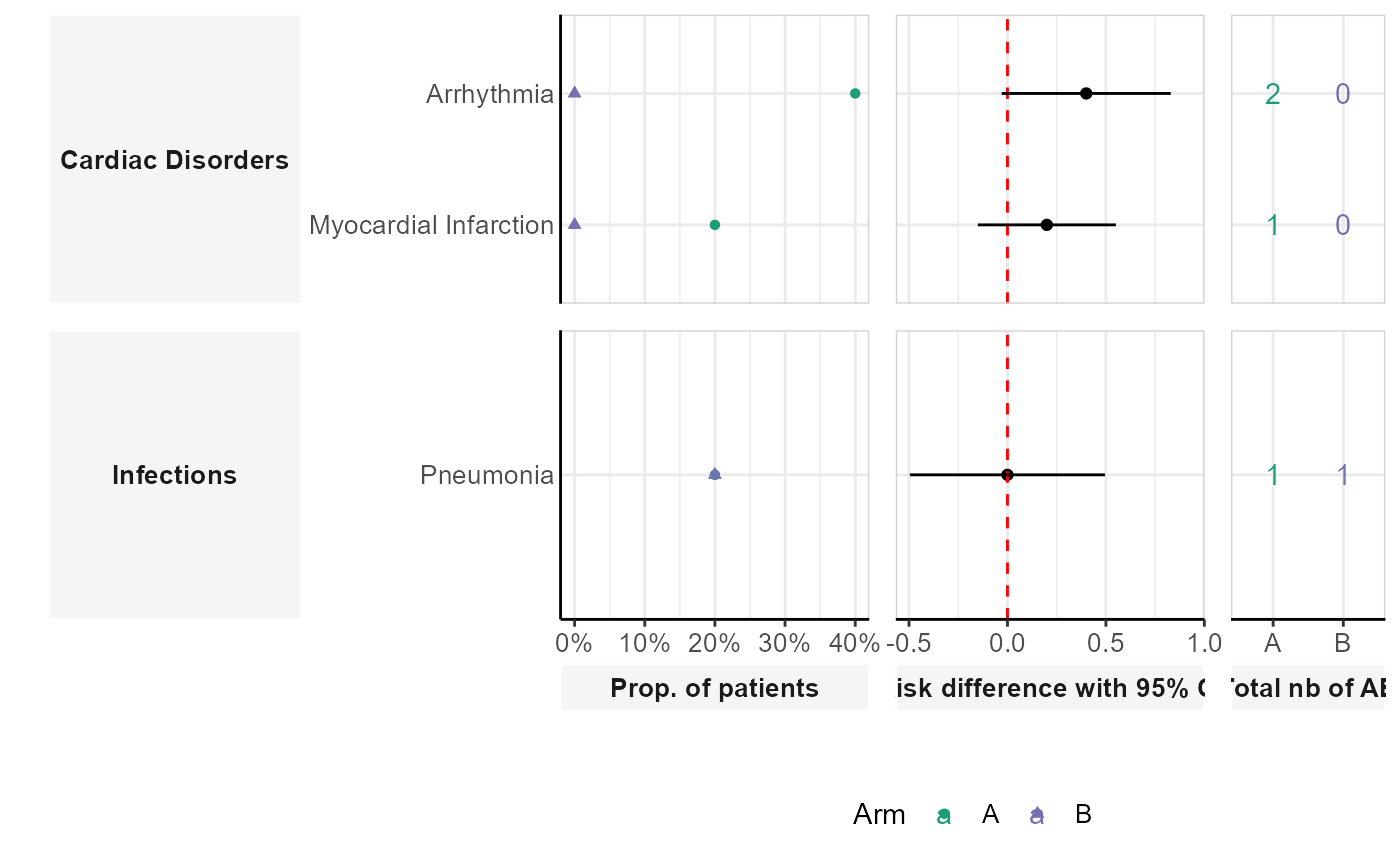
This function creates a dumbbell plot comparing the occurrence of adverse events across different patient groups. The plot includes the total number of adverse events, the proportion of patients affected, and the risk difference with confidence intervals.
plot_dumbell(
  df_pat_grp,
  df_pat_llt,
  ref_grp = NULL,
  colors_arm = c("#1b9e77", "#7570b3"),
  color_label = "Arm"
)
Arguments
- df_pat_grp
A data frame of patient groups. Must contain columns
USUBJID(patient ID) andRDGRPNAME(group assignment).- df_pat_llt
A data frame with USUBJID (subject ID), EINUM (AE ID), EILLTN (LLT identifier), EIPTN (PT identifier), EISOCPN (soc identifier) and EIGRDM (severity grade)
- ref_grp
(Optional) A reference group for comparisons. Defaults to the first group in
df_pat_grp.- colors_arm
A vector of colors for the patient groups. Defaults to
c("#1b9e77", "#7570b3").- color_label
A string specifying the legend label for the groups. Defaults to
"Arm".
Value
A ggplot object displaying the dumbbell chart.
Examples
df_pat_grp <- data.frame(
 USUBJID = paste0("ID_", 1:10),
 RDGRPNAME = c(rep("A", 5), rep("B", 5))
)

df_pat_llt <- data.frame(
  USUBJID = c("ID_1", "ID_1", "ID_2", "ID_4", "ID_9"),
  EINUM = c(1, 2, 1, 1, 1),
  EILLTN = c("llt1", "llt2", "llt1", "llt3", "llt4"),
  EIPTN = c("Arrhythmia", "Myocardial Infarction", "Arrhythmia", "Pneumonia", "Pneumonia"),
  EISOCPN = c("Cardiac Disorders", "Cardiac Disorders", "Cardiac Disorders",
  "Infections", "Infections"),
  EIGRDM = c(1, 3, 4, 2, 4)
)

plot_dumbell(df_pat_llt = df_pat_llt, df_pat_grp = df_pat_grp)
#> `height` was translated to `width`.